What I do
I'm forever intrigued by the endless stream of data that measures our world.
Whether about a certain demographic or a whole nation, a sports team or a disease, the money we spend or the problems we face, an infinite supply of numeric stories illuminate our times.
I love not only telling these stories, but showing them.
As a visual communicator, my expertise blends three specialized skill sets:
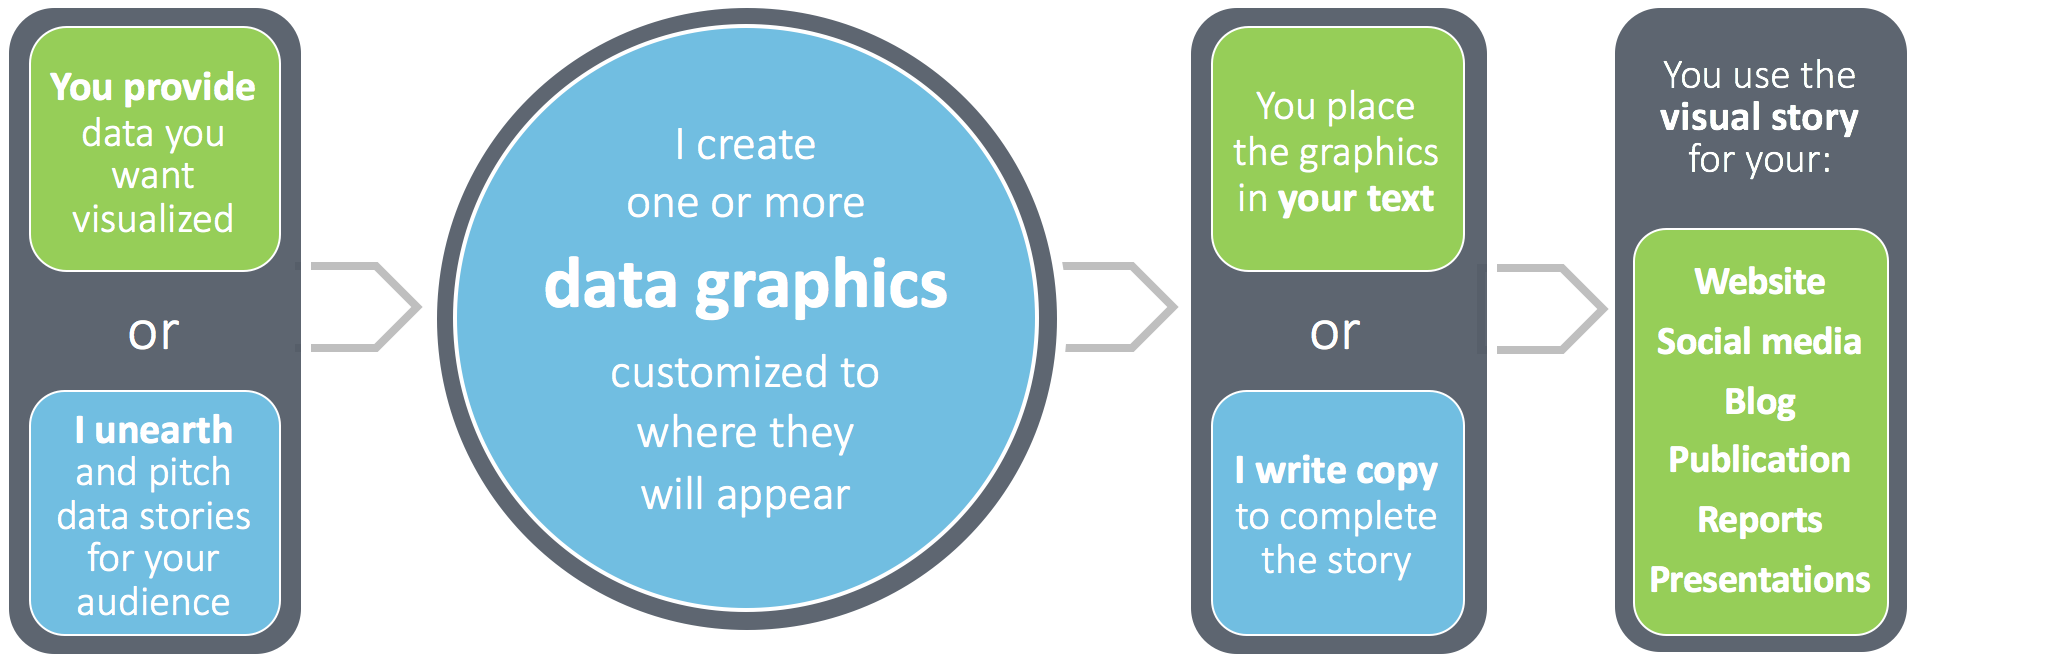
No. 1 - Mining the best data stories
I can work with datasets of any size to identify the most compelling story lines – organizing and analyzing the information in Excel, making new computations where necessary, and researching sources for deeper or broader data detail. Alternatively, I can dig into prepared findings of a study, survey or poll to suss out the most interesting angle for a particular audience.
No. 2 - Creating clear and beautiful visualizations
After choosing a data focus, I visually convey the story in graphics that draw readers in and make the message easy to grasp and digest. Here I mash up my advanced spreadsheet graphing skills with a designer's aesthetic and understanding of your visual brand to produce crisp, appealing, yet serious data graphics that blend perfectly into your content.
No. 3 - Writing to complete
Though my core product is numeric and the output visual, the right words are still critical for completing the story. From snappy headlines that catch a reader's attention to perfect wording and grammar for the text within a graphic to articles that provide the surrounding narrative, I draw daily on my skills as a writer and my long career in communications.
Have your own data stories that would pop with more visuals? Here are ways we can work together.